

INTERNATIONAL. Welcome to the seventh edition of the Moodie Davitt SPEND Index, a platform that tracks the effects of currency fluctuations across leading travelling nationalities and destinations – a key driver of travel retail spending.

Among all the factors affecting travel between nations, exchange rates are one of the most important, as they are central to determining relative spending power.
The Moodie Davitt SPEND Index examines the changing value of selected home currencies against other currencies abroad. That carries significant weight when it comes to decisions about whether or where to travel, and travellers’ propensity to shop while overseas.
Predicting currency developments is one of the toughest forecasting exercises anyone, even the most insightful experts, can undertake. There are several methods to forecast rates of exchange between currencies although these methods are in the main used by forex traders and equivalent.
Economic fundamentals such as supply and demand for a currency, rate of inflation, capital flows, budget deficits and economic growth play a primary role in determining a currency’s value.
Typically, a politically stable country with a developing economy sees its currency strengthen. The opposite is valid, of course, for countries suffering from political instability and weak economies. A currency is not, however, constantly increasing or decreasing in value vis-à-vis other currencies. Currency valuations and exchange rates change over time for a variety of reasons, including political change, a country’s national and international monetary policy, and concerns about a country’s debts.
Anyone who at this time last year predicted the strengthening of the Russian Ruble and the Thai Baht and, at the same time, the weakening of the South Korean Won and the Brazilian Real, is to be congratulated. An investment in these four major currency developments in 2019 will have produced an appreciable return now, one year later.

Among the 15 currencies included in the Moodie Davitt currency basket, the Russian Ruble performed the best in 2019, appreciating on average by +11.6% against the other currencies in the basket. The Thai Baht was second with a +8.0% increase. Both the Russian Ruble and the Thai Baht are regarded as ‘emerging market’ currencies – effectively meaning that they are more volatile and subject to major swings in their valuation compared to currencies from more mature and stable economies.
Taking a broader perspective, looking at the currencies not included in the Moodie Davitt currency basket, the overall winning currency in 2019 was the Ukrainian Hryvnia (UAH). Analysis shows that the Ukrainian currency gained on average by +19.2% against the 161 other currencies in the world in 2019, including +17.0% on the US Dollar and +19.5% on the Euro.
Among the 15 currencies in the Moodie Davitt basket that suffered the most, the South Korean Won takes the top spot. In 2019 the Won lost on average -5.1% of its value against the other 14 currencies whilst the Brazilian Real has the second-biggest decrease at -5.0%.
Notably, out of the 15 currencies included in the Moodie Davitt currency basket, only five showed gains in 2019 while no less than 10 currencies fell in value. This suggests that governments and central banks around the world in 2019 opted to keep the value of their respective currency low with the intention of stimulating exports (including boosting duty free and travel retail sales to foreigners visiting their country), shrinking trade deficits and reducing the country’s debt burden.
One method of keeping a country’s currency ‘cheap’ is for a central bank to keep interest rates low, down to zero level and even negative. Low interest rates do not encourage capital inflows or people saving in bank accounts that could add to a currency’s valuation.
Critically, in the context of duty free and travel retail, a weak or weakened currency significantly reduces the overseas spending power of a nation’s citizens. This may have consequences for the level of outbound travel from a country and the spending power of those who travel abroad.
The nationalities that enjoy an increased spending power (‘Winners’), based on the evolution of their domestic currency over the past 12 months (up to 31 December 2019) versus a basket of other currencies, are listed below.

A SPEND Index of less than 100 (‘Winners’) indicates that the spending power of this nationality has improved over the past year due to a stronger currency. Likewise, a SPEND Index greater than 100 (‘Losers’) indicates that the spending power of this nationality has weakened due to a weaker home currency.
The nationalities and travellers that benefited the most from currency movements in 2019 (see table above) are those from Russia and Thailand. Additional nationalities that saw their currency and SPEND power strengthened are those from Canada, the UK and Switzerland. Currency values and rates of exchange on 31 December 2019 have been compared to those valid on 31 December 2018.
With a SPEND Index at 89.72, as for Russia, a basket of products that cost RUB (Russian Rubles) 100.00 on 31 December 2018 now only costs RUB89.72 on average (all countries and destinations), a significant saving of +10.3%.
The Russian Ruble is the world’s second oldest national currency, only surpassed in age by the Pound Sterling (GBP), and is the 18th most frequently traded currency on the forex market. The Ruble ranks as the world’s seventh most volatile currency – any prediction about the Ruble’s continued strength and even strengthening in 2020 may be a very risky bet indeed.
The Russian currency rebounded in 2019 from a weak and troubled 2018 that included some excessive sell-offs. The strengthening of the Ruble was supported by the Russian stock market closing 2019 as the best globally in US Dollar terms, a lack of new sanctions imposed by the US and the EU, stable oil prices, and several rate cuts by the Central Bank of Russia, which helped boost economic growth.
‘International elite shoppers’, defined as the top 0.5% of tax free spenders, account for 17% of global tax free income. According to tax free shopping specialist Global Blue, the ‘international elite shopper’ spent an average of US$61,000 across 12 transactions spread over three trips per year. Russians are said to represent 6% of these ‘international elite shoppers’.
Ranked second, Thai travellers noted a significant strengthening of their currency in 2019. In the table above Thailand shows a SPEND Index at 92.71, meaning that Thai travellers today make a saving of -7.3% on their duty free purchases and spending abroad compared to one year ago.
The surge in the value of the Thai Baht in 2019 is good news for Thai travellers going abroad – to the tune of some 10 million in 2019 – benefiting from an increased SPEND power. But the highly-valued Thai Baht also poses problems and challenges to the Thai domestic tourism and export industries. The Thai tourism industry alone represents about 20% of Thailand’s GDP.
The currently strong Thai Baht is, among others, due to a healthy domestic economy and close to zero inflation. These two major factors attract huge amounts of foreign capital, boosting the Baht’s valuation.
Thailand is expected to have welcomed close to 40 million visitors in 2019, just about the same as in 2018. Trade sources blame this no-growth scenario mainly on the strength of the Baht, the impact of the US-China trade war and an overall mixed performance in the tourism sector.
In third place, Canadians travelling abroad saw their dollars reaching farther in 2019 than in 2018. With a SPEND Index at 96.26, Canadians now make an appreciable saving of -3.7% on average (all destinations) on their duty free purchases. At border shops located on the US side of the Canada/US border, the saving comes to -4.8%, due to the appreciation of the Canadian Dollar (CAD) against the US Dollar in 2019.
In fourth is the British Pound (GBP). With a SPEND Index at 97.42, Brits travelling abroad enjoy a saving of -2.6% (on average, all destinations) on their travel retail purchases. In EU countries, the saving comes to -5.8%. The British Pound has been through a rollercoaster year in 2019 but sprinted toward the end of 2019 after the UK exit from the EU on 31 January 2020 became clear.
The SPEND Index also offers the possibility to study details and numbers between pairs of nationality and destination country. Destinations are given as countries rather than cities. The changes in any one nationality’s spending power in a destination country referred to naturally applies to all cities and duty free and travel retail shops there.

As the above table shows, the Russians and the Thais were the big SPEND power winners in 2019. In the top 12 ranking, the Russians are listed with eight destination countries where they make significant savings and the Thais with four.
In the first six months of 2019, close to 19.9 million Russians made trips to 175 countries abroad representing an increase of +6.0% on the same period in 2018.
Russians’ acquired spending power in 2019 was evidently not enough to attract them to go to Brazil (rank number 1 in the table above), South Korea (rank 2) or India (rank 3) to any significant extent as these countries are well outside of the top 10 countries Russians visit the most.
Many Eurozone countries (rank 4, SPEND Index 87.56, saving -12.4%), however, saw a significant growth in incoming Russian tourists in the first half of 2019. These included: Montenegro (+51%), Slovenia (+44%), Italy (+19%) and, at a lower growth rate, Finland (+6%) and Germany (+6%). Turkey still remains the most popular destination for Russians travelling abroad.
Thai travellers benefitted from their increased SPEND power in the already popular destination South Korea (rank 6, SPEND Index 88.58, saving -11.4%). During 11 months in 2019 up to the end of December, 504,886 Thai visitors arrived in South Korea, up +2.2% on the same period in 2018. The Eurozone countries (rank 12, Spend Index 89.94, saving 10.1%) also account for a healthy influx of Thai travellers.
Above we have summarised the winning nationalities and currencies in 2019.
The 10 nationalities that have lost in terms of their SPEND power are:
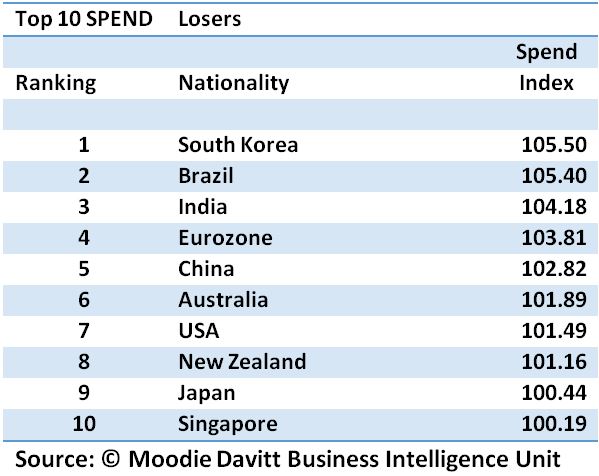
The above 10 countries, and outbound travellers from these countries, have all seen their currencies weaken over the past year, effectively meaning that today their currencies are worth less than one year ago. Focusing on the South Koreans, with a SPEND Index at 105.50, a basket of products that cost South Korean Won (KRW) 100.00 on 31 December 2018 now one year later costs KRW105.50 on average (all destinations), an increase in cost of +5.5%.
The South Koreans are seasoned international travellers and important customers in the world’s duty free and travel retail shops. In 2018, it is estimated that South Koreans spent US$1.4 billion in duty free and travel retail shops when abroad in addition to the about US$2.0 billion that they spent in their own duty free shops at home.
Between January and November 2019, a total of 26.2 million South Koreans travelled abroad, which is +0.7% up on the same period in 2018. The weakness of the South Korean Won began to have an impact on the number of departures of South Koreans as from August 2019, when this number fell by -3.7%. In the months that followed, this declining rate in outbound travel accelerated downwards: -7.9% in September, -8.3% in October and -9.0% in November.
The depreciation of the South Korean Won also means that South Korea has become an even more attractive destination for travellers the world over. During the 11 months in 2019 up to the end of November, some +14.4% more visitors arrived in South Korea compared to the same period in 2018. Visitor arrivals from China, the most important visitor source country, surged during the period by +26.4%, with the Chinese representing well over one third of all visitors.
In November 2019 duty free sales in South Korea grew by +34.3% to an all-time monthly high, with the Chinese driving this surge in business in what is the world’s biggest travel retail market.
In the same month, duty free sales to foreigners rocketed +43.4% while sales to South Koreans were down -2.8%. Duty free sales to South Koreans have recorded negative growth in eight of the first eleven months of 2019 and a recovery is not expected until there is a notable return in the growth of South Korean outbound travel.
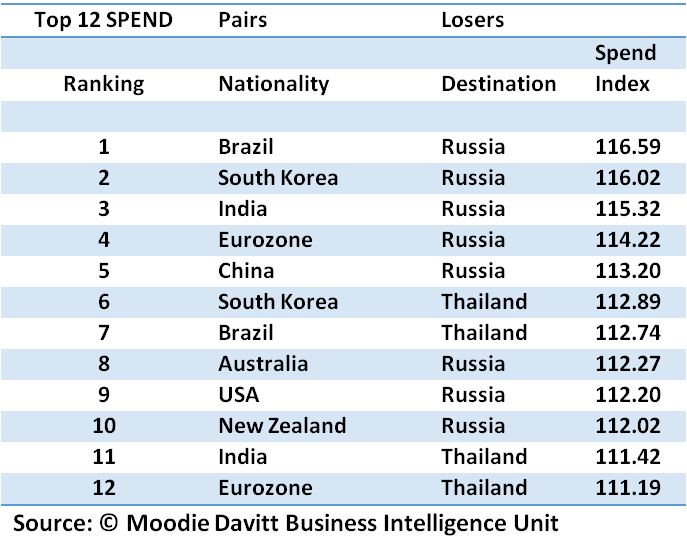
Several nationalities suffer from the fact that Russia and Thailand respectively have become more costly to visit due to the appreciation of these two countries’ currencies in 2019.
Brazilians now find it more expensive to shop in Russia (rank number 1, SPEND Index 116.59) than one year ago due to the weakening of the Brazilian Real and the strengthening of the Russian Ruble in 2019. Brazilians now spend +16.6% more on their travel retail purchases in Russia compared to one year ago. The same pattern is true of South Koreans, Indians, Eurozone citizens and Chinese (rank numbers two to five) visiting Russia: shopping has become more expensive.
From a SPEND power standpoint, Thailand has become a less favourable destination for the important South Korean outbound travellers (rank number 6, SPEND Index 112.89) who now pay +12.9% more for their duty free purchases in Thailand. South Korea is the fourth most important visitor source country to Thailand after China, Malaysia and Russia.
Thai duty free traders and parties in the tourism sector have reasons to fear that additional (to South Korea) popular visitor source countries such as India (rank number 11, SPEND Index 111.42) and the Eurozone countries (rank number 12, SPEND Index 111.19) may react adversely to the ‘expensive’ Baht which would dampen visitor growth numbers from these countries onwards. India, France and Germany are among Thailand’s top 10 visitor source countries.
Tourism sources in Thailand have already noticed that price-sensitive and budget-conscious travellers of multinational origins are rethinking their travel plans for 2020, with Indonesia (Bali) and Vietnam becoming two interesting alternatives to visiting Thailand.
ABOUT THE INDEX The Moodie Davitt SPEND Index analysis embraces 210 nationality and country of destination pairs, as well as 15 averages each for nationalities and destinations (= 240 x value indicators). It will continue to monitor the consequences and possible impacts of currency fluctuations on duty free and travel retail trade in the months ahead. |
PREVIOUS EDITIONS OF THE MOODIE DAVITT SPEND INDEX
14 March 2018
30 May 2018
28 November 2018
8 April 2019
9 August 2019
23 October 2019