

ASIA PACIFIC. China’s dominance of the Asia Pacific travel market is underlined in a major new MasterCard study released today.
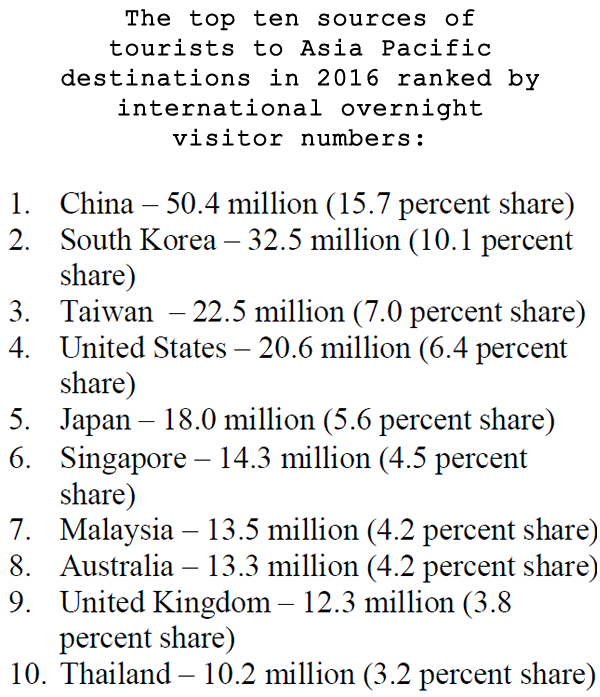
In 2016, China will continue to contribute the largest share of tourists to Asia Pacific, with 50.4 million Chinese tourists projected to travel to destinations across Asia Pacific. This represents 15.7% of total international overnight arrivals in the region – China’s biggest share of the region’s travel market since 2012.
In 2016, Chinese travellers are expected to spend US$45.3 billion in Asia Pacific destinations, making up 18.2% of total tourist expenditure in the region. While MasterCard did not break down that spend by category, it is likely that the Chinese share of shopping spending would be even higher – meaning that more than a fifth of travel retail shopping in the region now comes from a single nationality. In certain countries such as South Korea (especially) and Thailand the Chinese spend is overwhelmingly dominant.
MasterCard’s Asia Pacific Destinations Index ranks 167 Asia Pacific destinations in terms of visitor number, visitor spend and nights stayed. The destinations, which include island resorts, towns and cities, are drawn from 22 countries and represent 90% of all international overnight arrivals within the region.
Four of the top five origin countries with the highest contribution of international overnight arrivals to Asia Pacific destinations are from Northeast Asia – South Korea (32.5 million; 10.1%) ranked second after China, followed by Taiwan (22.5 million; 7%.0), the USA (20.6 million, 6.4%) and Japan (18.0 million; 5.6%). The four Northeast Asian markets are expected to contribute 38.4% of total international overnight arrivals in the region in 2016.
The dramatic expansion of outbound China tourism to Asia Pacific destinations can be seen in the growth figures. China catapulted from the sixth biggest contributor of tourists to Asia Pacific in 2009 (a 5.8% share of total Asia Pacific international overnight arrivals) to reach the top spot in 2012 with a 9.8% share. It has retained top position ever since to this year’s 15.7% share driven by +25.9% compounded average annual growth rate (CAGR) from 2009 to 2016.
Japan in contrast has seen its share of tourists to Asia Pacific destinations drop, from top spot in 2009 (9.7% share) to fifth in 2016 (5.6%) with a +1.1% CAGR from 2009 to 2016.
The USA at number four has consistently been the highest ranked non-Asia Pacific origin country since 2009. The UK is the only other non-Asia Pacific origin country within the top ten at ninth place.
“In the past few years, the mix of tourists in key Asia Pacific destination has changed significantly reflecting the economic rise of China and other emerging Asian economies,” commented MasterCard Executive Vice President, Global Products & Solutions, Asia Pacific, Matthew Driver. “Where you might have found tourists from Japan, Hong Kong, South Korea and the United States, you are now much more likely to come across travelers from mainland China.
“The impact of the economic transformation of China and specifically the rise in disposable incomes is the biggest driver of tourism growth globally. While we are expecting similar growth from India and Indonesia in the longer term, as well as other segments such as Halal tourism, Chinese tourists are more concentrated in Asia and impact markets at a larger scale.
“This growth is very positive for the Asia Pacific tourism industry and there remains a huge opportunity for industry players to tap into it and benefit from it. Like any other important market, players can gain advantage if they identify the relevant segments of the market for their business, understand their unique needs and then design products and services to best cater to their needs, complementing the services they provide to other key traveller segments.”
Of the top ten Asia Pacific destinations, four have China as their biggest source of tourists, led by Seoul with Chinese tourists projected to make up a startling 50.5% of international overnight arrivals, followed by Bangkok at 38.2%, Pattaya at 28.8% and Phuket at 25.6%.
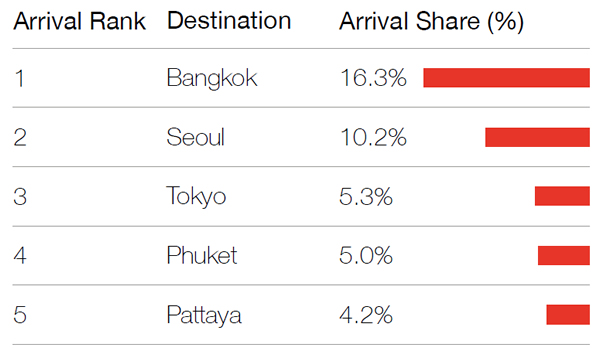
The top ten most popular Asia Pacific destinations for Chinese tourists in 2016 ranked by international overnight visitor numbers:
| 1. Bangkok – 8.2 million (16.3 percent share of arrivals) 2. Seoul – 5.2 million (10.2 percent share of arrivals) 3. Tokyo – 2.7 million (5.3 percent share of arrivals) 4. Phuket – 2.5 million (5.0 percent share of arrivals) 5. Pattaya – 2.1 million (4.2 percent share of arrivals) | 6. Osaka – 1.9 million (3.7 percent share of arrivals) 7. Singapore – 1.8 million (3.6 percent share of arrivals) 8. Taipei – 1.6 million (3.3 percent share of arrivals) 9. Jeju – 1.5 million (3.1 percent share of arrivals) 10. Bali – 1.4 million (2.7 percent share of arrivals) |
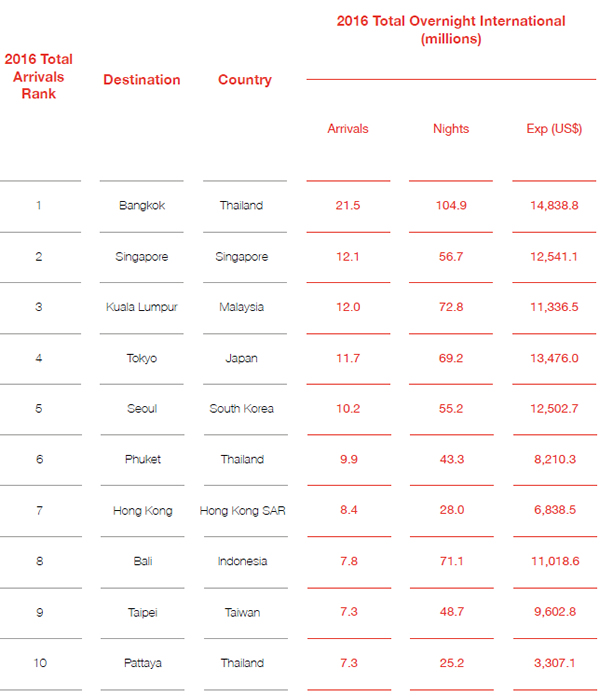
The top ten Asia Pacific destinations ranked by international overnight visitor numbers:
| 1. Bangkok – 21.5 million 2. Singapore – 12.1 million 3. Kuala Lumpur – 12.0 million 4. Tokyo – 11.7 million 5. Seoul – 10.2 million | 6. Phuket – 9.9 million 7. Hong Kong – 8.4 million 8. Bali – 7.8 million 9. Taipei – 7.3 million 10. Pattaya – 7.3 million |
The top ten sources of tourists to Asia Pacific destinations in 2016 ranked by total expenditure:
| 1. China – US$45.3 billion (18.2 percent share) 2. South Korea – US$21.0 billion (8.4 percent share) 3. United States – US$16.2 billion (6.5 percent share) 4. Japan – US$15.8 billion (6.4 percent share) 5. Taiwan – US$13.9 billion (5.6 percent share)
| 6. Singapore – US$12.3 billion (4.9 percent share) 7. Australia – US$11.3 billion (4.5 percent share) 8. United Kingdom – US$10.3 billion (4.1 percent share) 9. Indonesia – US$8.8 billion (3.5 percent share) 10. Malaysia – US$8.7 billion (3.5 percent share) |
About the MasterCard Asia Pacific Destinations Index
The first MasterCard Asia Pacific Destinations Index is an offshoot of MasterCard’s annual Global Destination Cities Index.
In recent years, Asia Pacific cities have increasingly dominated the fastest growing and most visited destinations in the world. According to 2015’s MasterCard Global Destination Cities Index, five of the ten most visited cities in the world were in Asia Pacific.
The Asia Pacific Destinations Index takes a more in-depth, focused look at these tourism trends, ranking 167 destinations, including island resorts as well as towns and cities across the region, in terms of the total number of international overnight arrivals; cross-border spending; and the total number of nights spent at each destination. These 167 destinations are drawn from 22 countries across Asia Pacific and represent 90% of all international overnight arrivals within the region.
Public data is used in deriving the international overnight visitor arrivals and their cross-border spending in each of the destinations, using custom-made algorithms.
This Index and the accompanying reports are not based on MasterCard volumes or transactional data, the company pointed out.